Part 1 – Introduction to TNUoS and ITPEnergised unique modelling approach
Part 2 – Optimising Transmission Connected Colocation Projects and the impact of TNUoS
Part 3 – Optimising Transmission Connected Colocation Projects and TNUoS Connection and Use of System Code (CUSC) Modification Proposals (CMPs)
Part 4 – Colocation TNUoS versus Standalone technology TNUoS – Scottish Site Example
Part 5 – Colocation TNUoS versus Standalone technology TNUoS – 100MW Technology Units
Part 5 – Colocation TNUoS versus Standalone technology TNUoS – 100MW Technology Units
In this Part 5 George and Peter consider the potential implications of the TNUoS in colocation projects through simple 100MW technology units. Figures are illustrative.
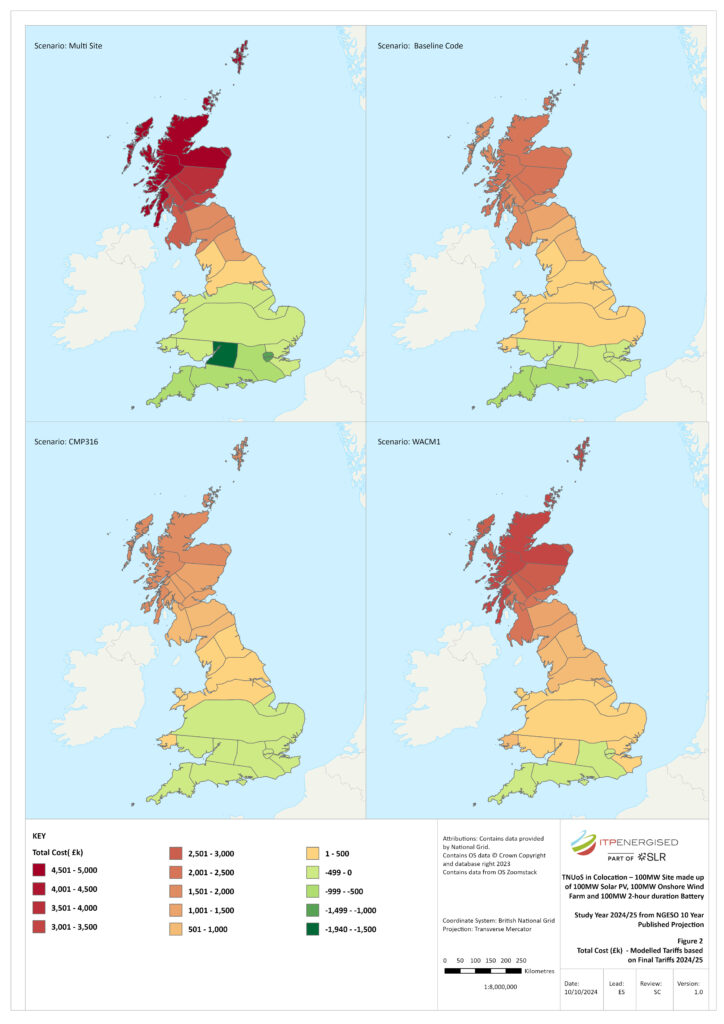
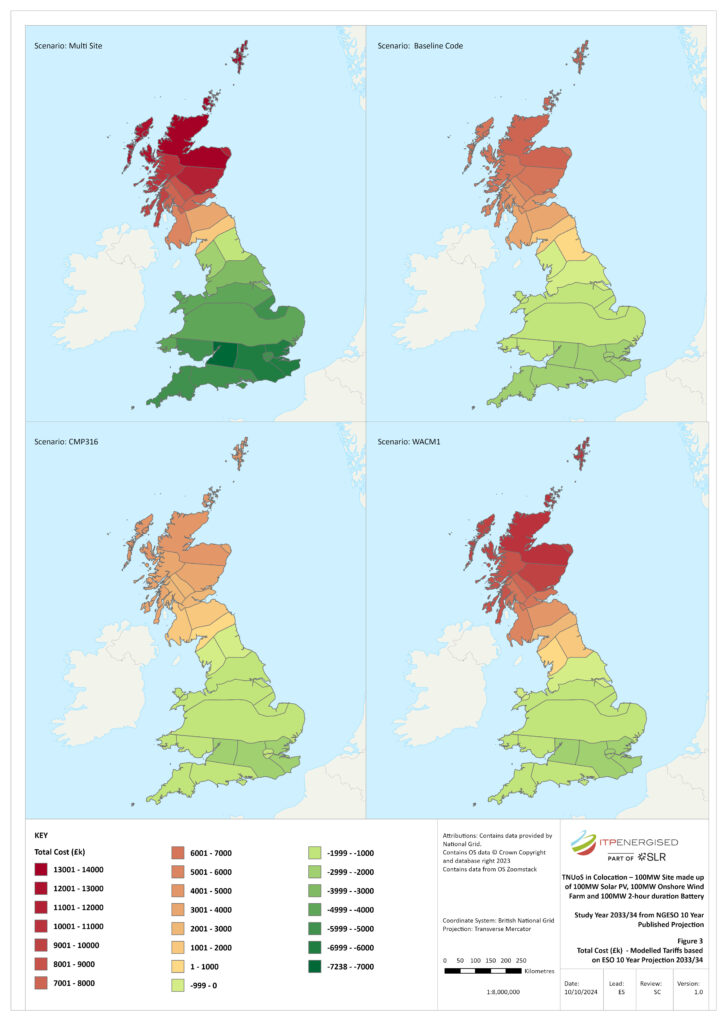
We studied annual charges for a typical 2-hour battery project, comprising a 100MW onshore wind farm and a 100MW solar PV farm combined with a 100MW battery storage system as the primary generation type. The assumptions for ALF and peak outputs are given below.

The TNUoS charges over GB for current 2024/25 published tariffs and 2033/34 tariffs based on the NGET 2023 10-year projection might look like this:


In both charts a steep drop in cost from positive (charge) to negative revenue stream) can be seen as we move south over GB from generation zone 1 to 27.
Conclusions
As can be seen from both our worked examples, the colocation projects in both Scotland and north of England benefit from lowered TNUoS charges across the technology base for colocation compared to standalone charges. The baseline (current version of the CUSC) code gives some benefit which is enhanced by CMP316 ‘Original’ solution but eroded by WACM1. The proposed CMP316 code changes have far less of an impact on generation zones 17 to 27, where typically a potential colocated site would benefit from a larger income stream by keeping the various generating technologies registered as separate sites. There would be impacts to connection costs to consider alongside this.
Project scale and configuration matters. The results will vary across the GB Generation Zones.
We are ready to help you identify where these savings are, using our TNUoS prediction service based on our unique Digital Twin of the GB Power Network. We are also able to help our clients with deep modelling of portfolio risk and return allocation to help design global portfolios and assets.
You can download a PDF of Part 5 here.
For more information on this service, please contact Peter at peter.lo@itpenergised.com and on comprehensive TNUoS modelling using a digital twin of the UK network, George at george.douthwaite@itpenergised.com.
