Summary
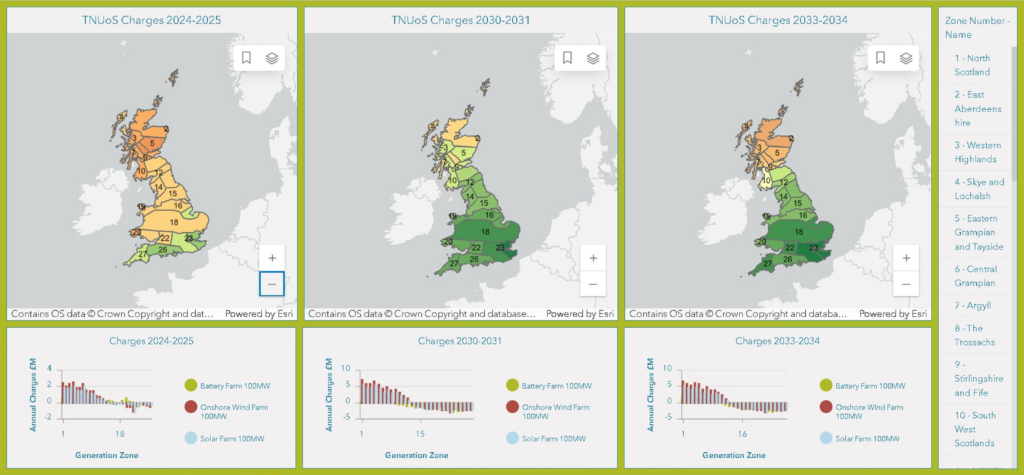
Transmission Network Use of Systems (TNUoS) charging is how the Transmission Operators recover the costs of installing and maintaining the transmission power network in GB. In Figure 1 below, the ITPEnergised GIS Team has shown National Grid Electricity System Operator (ESO) published TNUoS charges geospatially across GB and as annual charges for typical 2 hour duration 100MW battery project, a 100MW onshore wind farm and a 100MW solar PV farm across the 27 generation zones in three time stamps from the present day, year 2030/31 and year 2033/34. The charges in the north more than double from 2030/31 largely due to the network reinforcements brought in to facilitate ScotWind. In part two of this series we will look at how the TNUoS charges are impacted in colocation.
How can TNUoS tariffs be estimated?
Recovered Revenue
The transmission network within GB is built and managed by several Transmission Operators (TO), some of which are Offshore (OFTO). Spending on new network infrastructure by these companies is approved by Ofgem, and their income regulated in the form of an Allowable Revenue (AR). This AR represents the cost of installing and maintaining assets on the transmission network, based both on the cost of capital depreciated over specified number of years as well as annual operational costs. This AR is recovered through TNUoS charging on behalf of the TOs by the ESO.
An overview of who pays TNUoS and what the various tariff elements are is given in this ESO publication “TNUoS in 10 Minutes” and the TNUoS Charging methodology is detailed in Section 14 of the Connection Use of Systems Code (CUSC).
Tariff structure
The TNUoS charges paid by generators consist of three elements:
- A Local Circuit Tariff, which partly recovers the costs of the assets required to connect a generator to the wider transmission system and as such is site specific. If the first onshore substation which the generator connects to is categorised as a Main Interconnected Transmission System (MITS) in accordance with CUSC 14.15.33, then there is no Local Circuit charge.
- A Local Substation Tariff, which recovers costs associated with the transmission substation equipment which facilitates the connection of generation. The Local Substation Tariff is set by ESO each year and is fixed for all generators.
- A Wider Tariff, which reflects the cost of providing additional generation capacity in an area of the transmission network. The wider, zonal, tariff often makes up the bulk of the TNUoS charges for onshore generators, particularly those located furthest north. The wider tariff is itself composed of a locational element and an Adjustment tariff set to achieve correct revenue recovery.
These £/kW tariffs are charged on the Transmission Entry Capacity (TEC) held by generators.
Wider TNUoS Tariffs
The Wider TNUoS charge provides a locational signal for investment. The TNUoS tariffs are calculated in the Tariff and Transport model.
The first part is the Transport Model. This is based on the Investment Cost Related Pricing (ICRP) approach, which calculates TNUoS tariffs that vary according to the incremental cost of supplying network capacity at different locations. The principle behind this approach is one of providing economic signals that allow users to factor their impact on the transmission network on siting decisions and hence provide an overall economic generation and transmission system for end consumers.
The second part converts this to actual tariffs, which includes an Adjustment calculation. This Adjustment Tariff was introduced to ensure compliance with the €2.50/MWh limiting Regulation (EU) No. 838/2010 or price cap. This is applied as a flat £/kW tariff over all generation zones, maintaining the Wider tariff differential but in some cases making the overall tariff negative (an income, for example for some assets located further south) rather than a charge for generation connected in that zone.
ICRP DCLF Modelling
The TNUoS model uses a £ cost per MW per km of a 400kV overhead line, the Expansion Constant (EC) and Expansion Factors (EF) applied to this for other line voltages and underground cables.
The Transport model runs a Direct Current Load Flow (DCLF) solver on a simplified map of the GB transmission system. The ESO Transport Model for the final 2024/25 TNUoS tariffs is based on 562 substations, giving rise to 1019 modelled nodes (voltage specific busbars and cross-boundary TO specific substation variations) and 1515 circuits between these nodes. Of the 562, 85 sub-stations are non-MITS, and have local circuit tariffs.
Following Project Transmit (2011) two Background Generations (BG) are run in the model. These both include the same underlying generation and demand mix, specified by node, but the various technologies are scaled back differently under each BG. Under each BG model run the first step is to solve the load flow for the given demand and generation. After that, an incremental 1MW is applied to each node in turn (scaling all demand proportionally) and for each the changes in energy flow over each circuit has a cost calculated based on EC and EFs. This gives an incremental MW cost at a nodal level, which is then averaged over each of the generation zones.
The two BGs each provide one element of the wider TNUoS tariffs, the “Year Round” and the “Peak Security”. These are applied depending upon the generation technology, and the site Annual Load Factor (ALF). The Adjustment is added on to the final calculation.
The Wider TNUoS tariff provides a locational charge that varies by generation zone. There are currently 27 generation zones defined over GB, but this number can change at the start of a new Network Price Control. This rezoning is tied to the variation in nodal TNUoS wider tariffs (before being averaged by zone) once the new Price Control transmission assets’ EC has been applied. The network has not yet been rezoned for transmission network price control RIIO-T2, which runs from 2021-2028, since the updated EC was seen as increasing the locational cost differential too much. See CUSC modification Proposal (CMP) CMP353 – “Stabilising the Expansion Constant and non-specific Onshore Expansion Factors from 1st April 2021 .”
ITPEnergised TNUoS Estimation Service
Within our own TNUoS estimations, we use the latest published ESO view of generation and demand from their live tariff and transport model and, by default, the year-on-year changes suggested by the four Future Energy Scenarios (FES). There is additional market information and our own experience which helps locate some of these changes, but further than this the TEC register is generally too overloaded to give a precise view of changes specifically in new generation.
Other current challenges include a view on how the costs of the transmission Offshore Meshed Network (OMN) will be recovered, and to the extent these costs will be socialised and included in the incremental 1MW load flow model. CMP419 and CMP426 have been raised to address some of these issues.
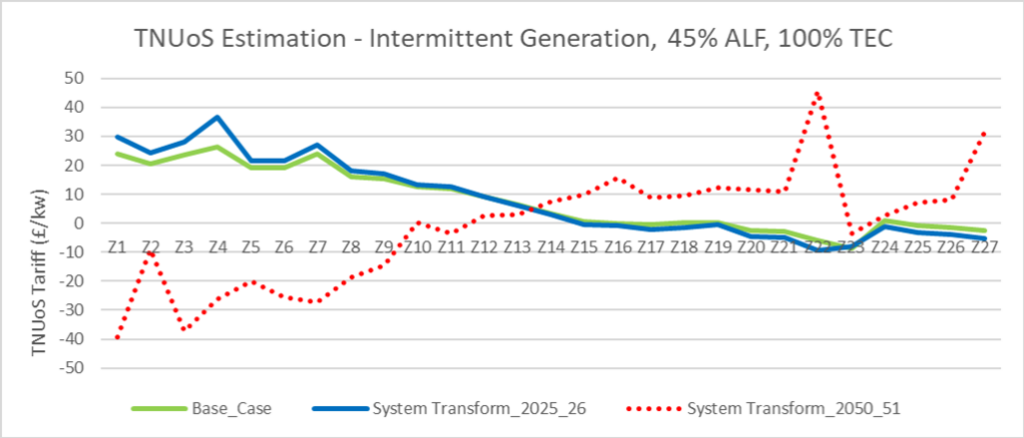
There has been a problem with the TNUoS model in recent years, and we welcome CMP424 which addresses this defect and provides a temporary fix for the Year Round background generation scenario, where the Year Round generation, driven mainly on renewable energy, currently exceeds the ‘Average Cold Spell’ (ACS) unrestricted peak winter demand. Without this CUSC change, or the non-codified model fix the ESO has been applying to their future year predictions, the North-South TNUoS differential would have been turned on its head. See figure 2 below, taken from a report we sent to and discussed with the ESO and Ofgem back in the first half of 2022 when requesting a change be made. The graph shows the effect of unconstrained TEC being applied as currently specified within the CUSC.
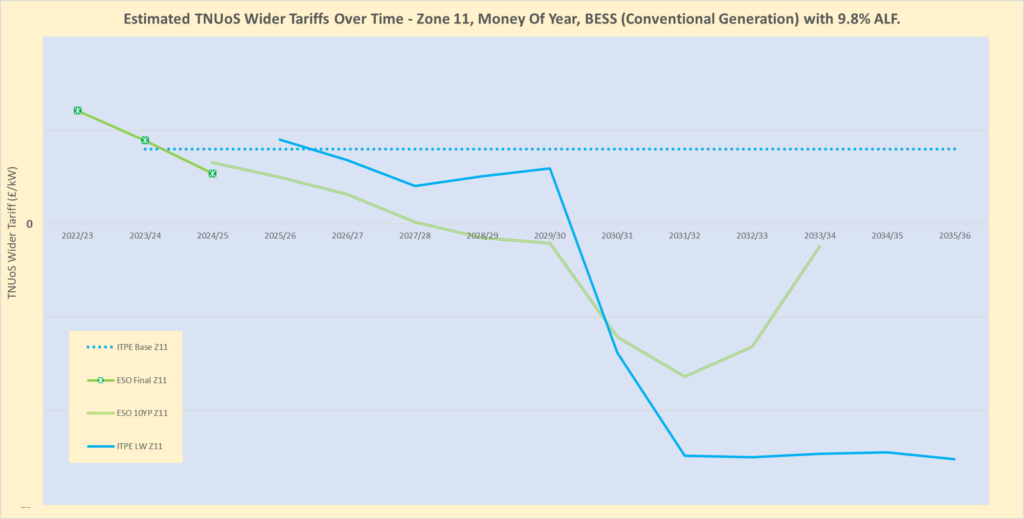
In Figure 3 below, ITPEnergised has compared their own ‘best view’ TNUoS estimation from March 2023 against the ESO 10-year projection from September 2023 for a zone 11 battery storage site with typical Annual Load Factor of 9.8%. Both use the non-codified TNUoS tariff fix, and we have used assumptions around Offshore Transmission Network Review (OTNR) including a mix of AC and DC circuit attributes in the OMN with unrestricted energy flows within that part of the network (any restrictions to flow into the OMN being applied at the last onshore MITS node).
In a later part of this series we will take a look at some of the reasons behind the variations in these forward looking views of TNUoS tariffs.
You can download a PDF of Part 1 Introduction to TNUoS Modelling here.
Please contact George Douthwaite at george.douthwaite@itpenergised.com for more information on ITPEnergised’s TNUoS tariff prediction service, Peter Lo at peter.lo@itpenergised.com for colocation sizing optimisation and Eleni Stavroulia at eleni.stavroulia@itpenergised.com for GIS services.